You pay more for every click. The store converts the same.
Rising CPCs against a flat conversion rate means the growth you are buying is margin, not revenue.
Traffic isn’t your issue. Conversion is.
We lift conversion rate, AOV and revenue per visitor for Shopify stores doing $1M–$10M. Tests, not decks.
Got it. Now pick a time.
Open the calendar →Twenty minutes on your store and your numbers. If we cannot help we will say so.
| Work | Result | Status |
|---|---|---|
| Medterra rebuild | +$2,334,142 | Shipped |
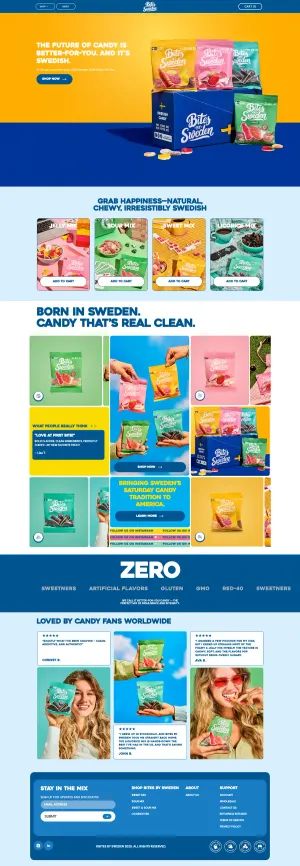
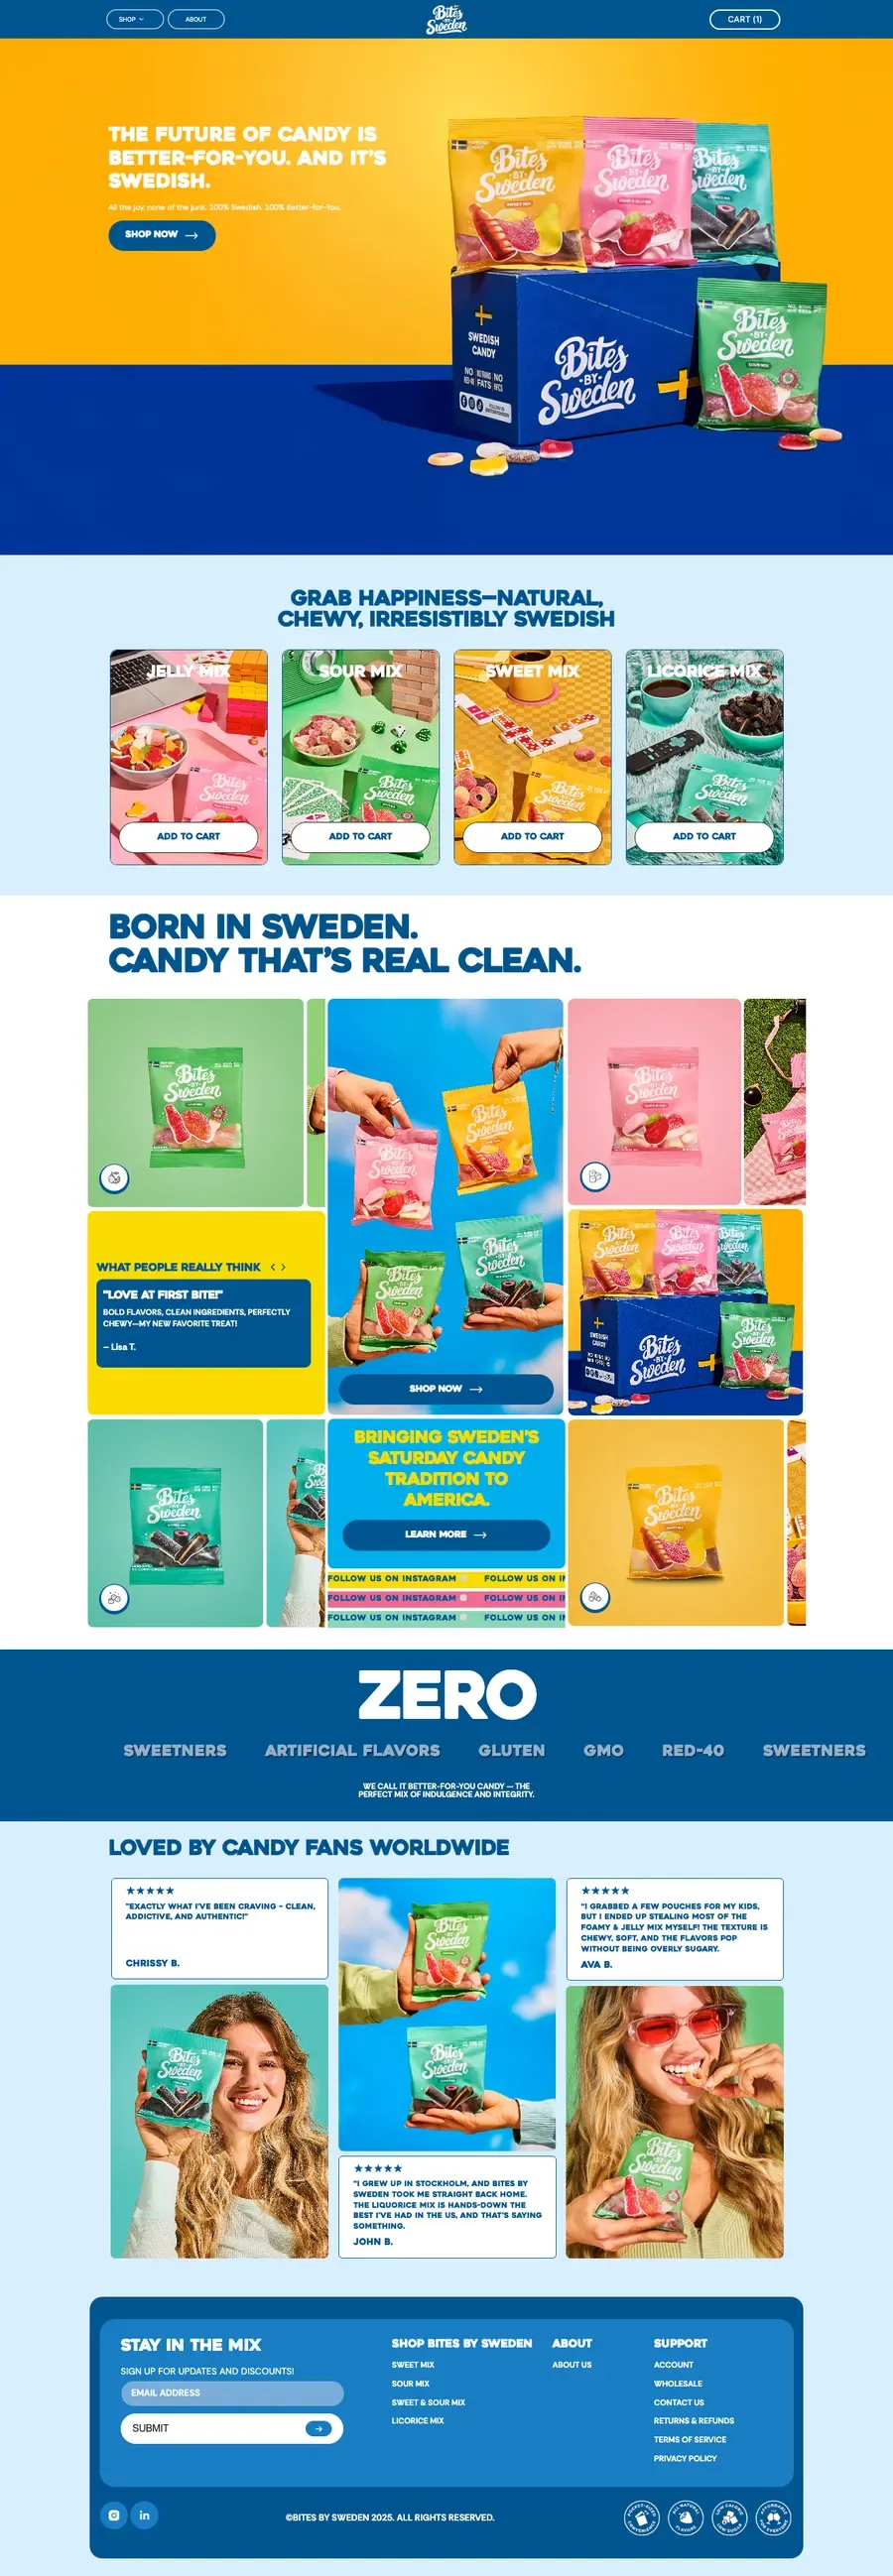
| Bites by Sweden rebuild | +58% CVR | Shipped |
| Raan hero PDP | +29% CVR | Shipped |
Published results. Basis on each write-up →
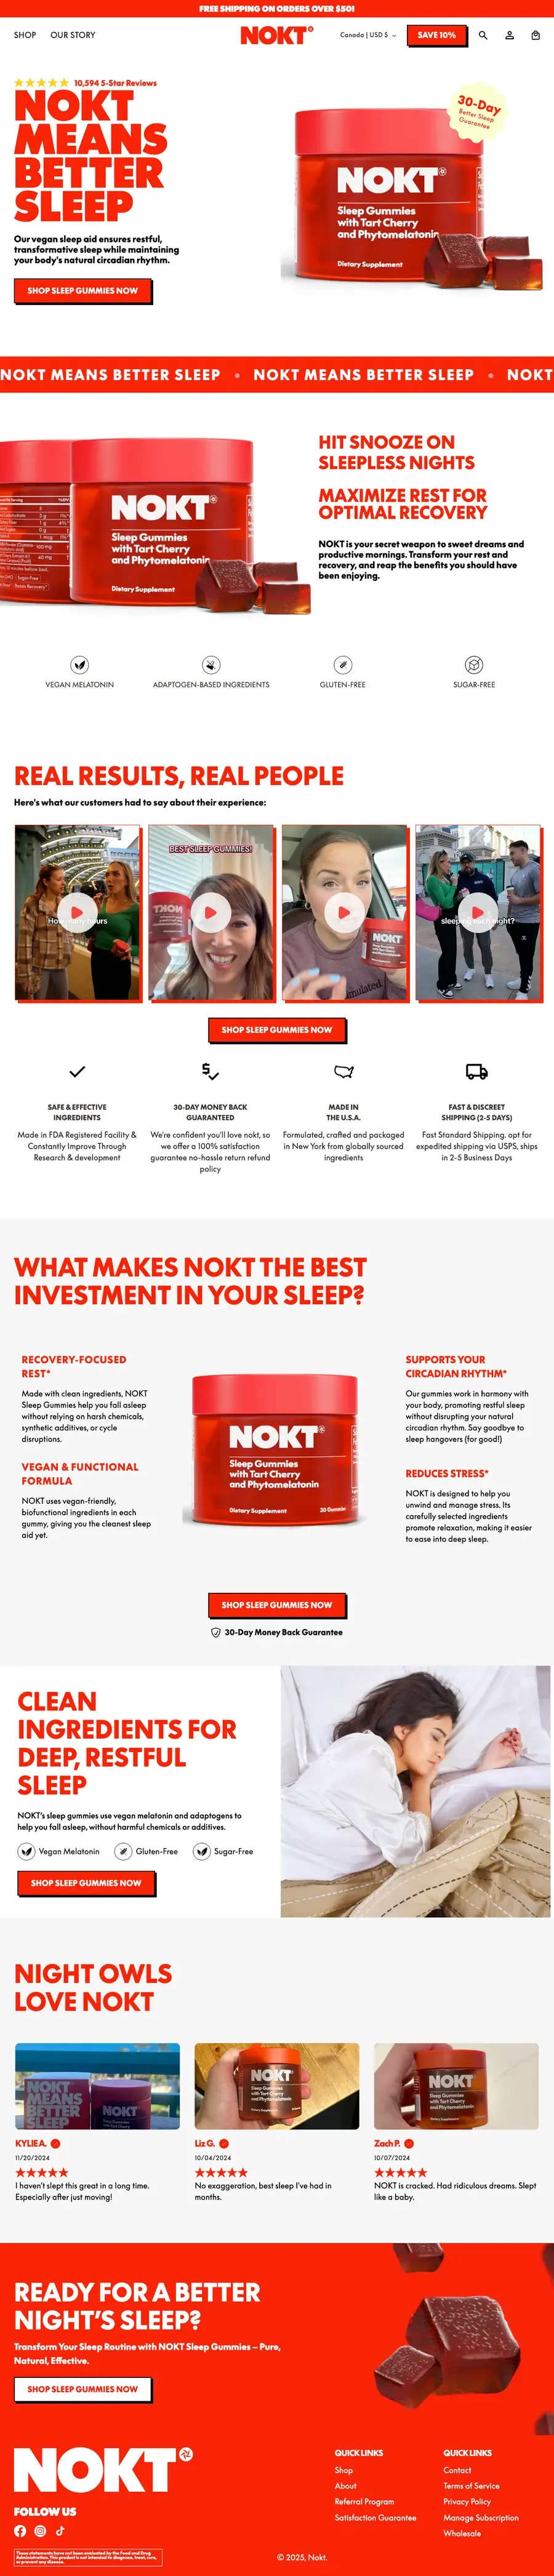

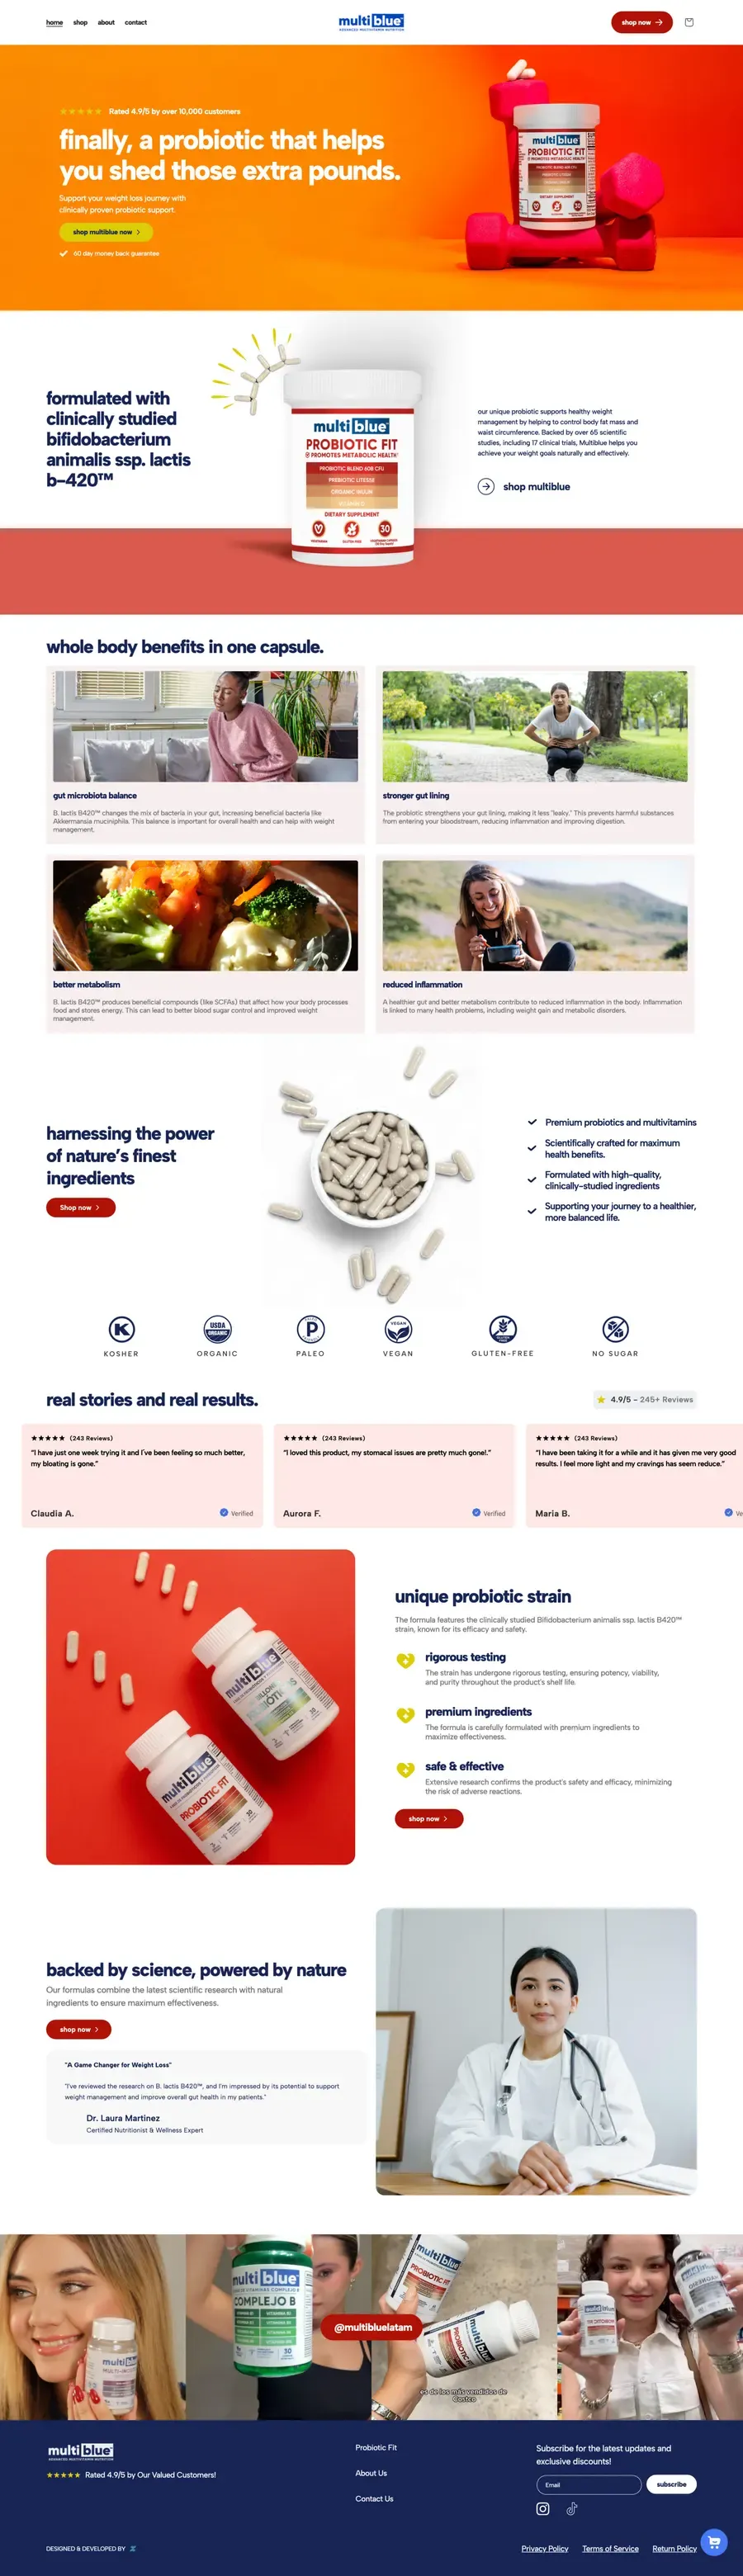


New revenue
$30M+
Added for clients, measured on their stores.
A/B tests shipped
2,000+
Sized before launch. Read when done.
Stores built
437+
Pages and stores, built from research.
Win record
39 of 71
Written-up tests that beat control.
















Most brands at $1M–$10M don't have a traffic problem. They have one of these three.
Rising CPCs against a flat conversion rate means the growth you are buying is margin, not revenue.
It cannot tell you which idea is worth your traffic, or run it, read it and ship the winner on your store.
Six weeks on a button colour, a “winner” at +0.3%, and a revenue line that looks exactly like last quarter.
Our own AI, trained on 2,000+ A/B tests, reads your data in hours and kills ideas that already lost. A person signs every call.






Analytics, session recordings, reviews and tickets, read until the leaks rank themselves.
→ A ranked problem listPages and fixes designed from the research, built into your theme by the same team.
→ Live in your themeSized before launch, read once at the planned stop. Losses reported like wins.
→ Won · lost · flatWinners go live. Losers get written up. The backlog reorders itself.
↺ Repeat, every month Brand clarity first. Then a store rebuilt so the right product is easy to reach. before-and-after Read it → Case study : 02 Bites by Sweden +58% conversion rate · −33% CAC Designed to crave. Built to convert. The value proposition lands in the first screen. engagement outcome Read it → Case study : 03 Raan +29% conversion rate · +31% add-to-cart Rebuilding trust around one product that had to convert. engagement outcome Read it → Higher ROAS. Same ad spend. Every number beside a build is a published result.

A starter-kit product page built around the decision a first-time buyer is actually making.
Rebuilt for cold traffic: the claim, the evidence for it, and the offer, in that order.

Rebuilt so a service business reads as bookable rather than browsable.
Put your store's numbers in and see what a single winning test is worth, before you decide whether the programme is.
Estimated monthly revenue: $750,000
For context: published client lifts on this site range +18% to +58%: a record, not a promise. Your traffic can detect a 10% lift in about 2 weeks, so testing is realistic.
You're missing out on…
$37,500
extra monthly revenue
$450,000 a year, on traffic you already paid for.
Book A CallThe full model with AOV drag is in the ROI calculator.
 ↑ $2,334,142
In CRO Incremental Revenue
 ↑ 33% Increase
In Conversion Rate
 ↑ 45% Increase
In Conversion Rate
In Average Order Value
 ↑ 29% Increase
In Conversion Rate
 ↑ $1,338,625
In CRO Incremental Revenue
 ↑ 29% Increase
In Conversion Rate
 ↑ 2× CVR
In Five Months
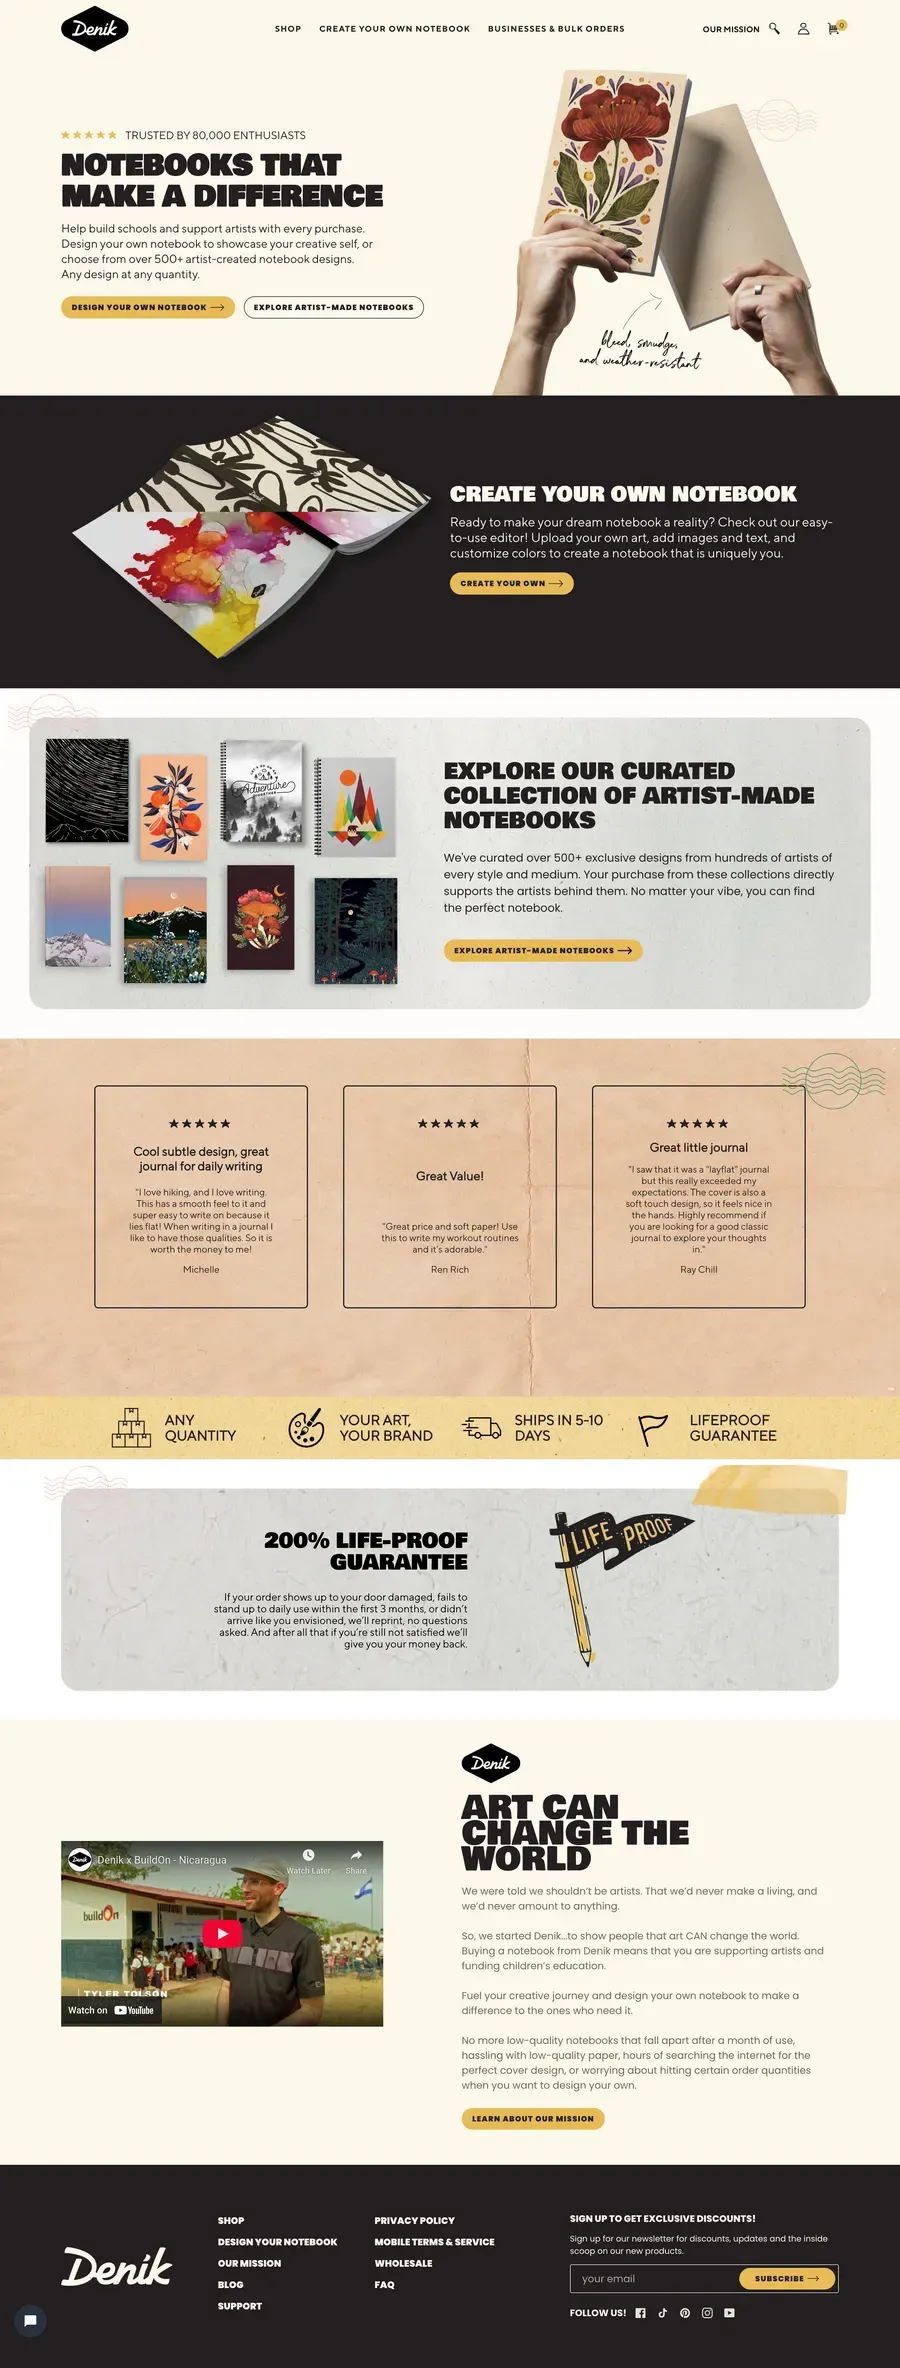
Built from your conversion research, not a theme catalogue, and you approve the direction before we build a page of it.
Get Website Help 
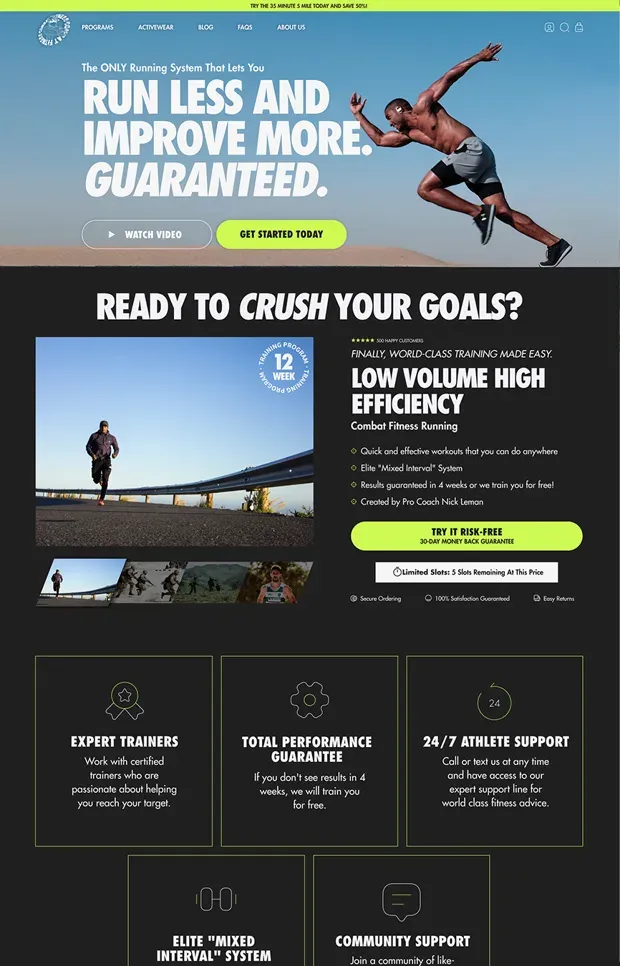
Pages that keep the ad’s promise, tested against the page they replace. Every result reported, either way.
Get Landing Page Help No guaranteed lift, a record instead: 39 of 71 written-up tests beat control, and the 32 losses are published too.
Optimize My Store
Deloitte strategy, then a seven-figure DTC brand of his own, every dark art of conversion learned on his own money. Kam is on every call, and every test on this site has his fingerprints. The full story →
$1,338,625
incremental annual revenue · Mums Candy · same ad spend
Out of 22 A/B tests, 14 were significant wins, generating $1,338,625 in incremental annual revenue — without increasing ad spend.
Conversion rate breakdown
5.41% ↑ 120%
2× CVR
in the first two weeks
They 2X our conversion rate in the first two weeks. Kam and Solvex are magical when it comes to increasing conversions!

Conversion rate breakdown
8.07% ↑ 52%
3%+ CVR
on every Solvex page
They build the highest converting landing pages - we haven't seen a conversion rate below 3% on a Solvex page

Conversion rate breakdown
10.79% ↑ 40%
+40% CVR
a confusing offer, turned into a story
They took our confusing offer and turned it into a story that prints sales. These guys understand CRO like nobody else.




Roughly 40,000 monthly sessions before A/B tests can conclude in sensible time. Under that, we fix what the research finds and measure before and after, or point you at the audit instead of a retainer. And the honest limit: the site is not always the problem. When that’s the case, the first call says so.
It gets written up in the same format as a winner and published to the record. Across the engagements written up so far, 39 of 71 tests beat control. A typical programme lands nearer one in five.
Usually not, and we will say so. Most stores need four or five specific fixes, not a new theme. When a rebuild genuinely is the answer, we say so upfront and scope it separately. No surprises.
Research starts the first week. Obvious fixes ship without waiting for a test; the first pages go into build in week two.
Twenty minutes on your store and your numbers. What is leaking, what to fix first, and an honest read on whether we can help at all. No deck, no pitch.
Got it. Now pick a time.
Open the calendar →Twenty minutes on your store and your numbers. If we cannot help we will say so.